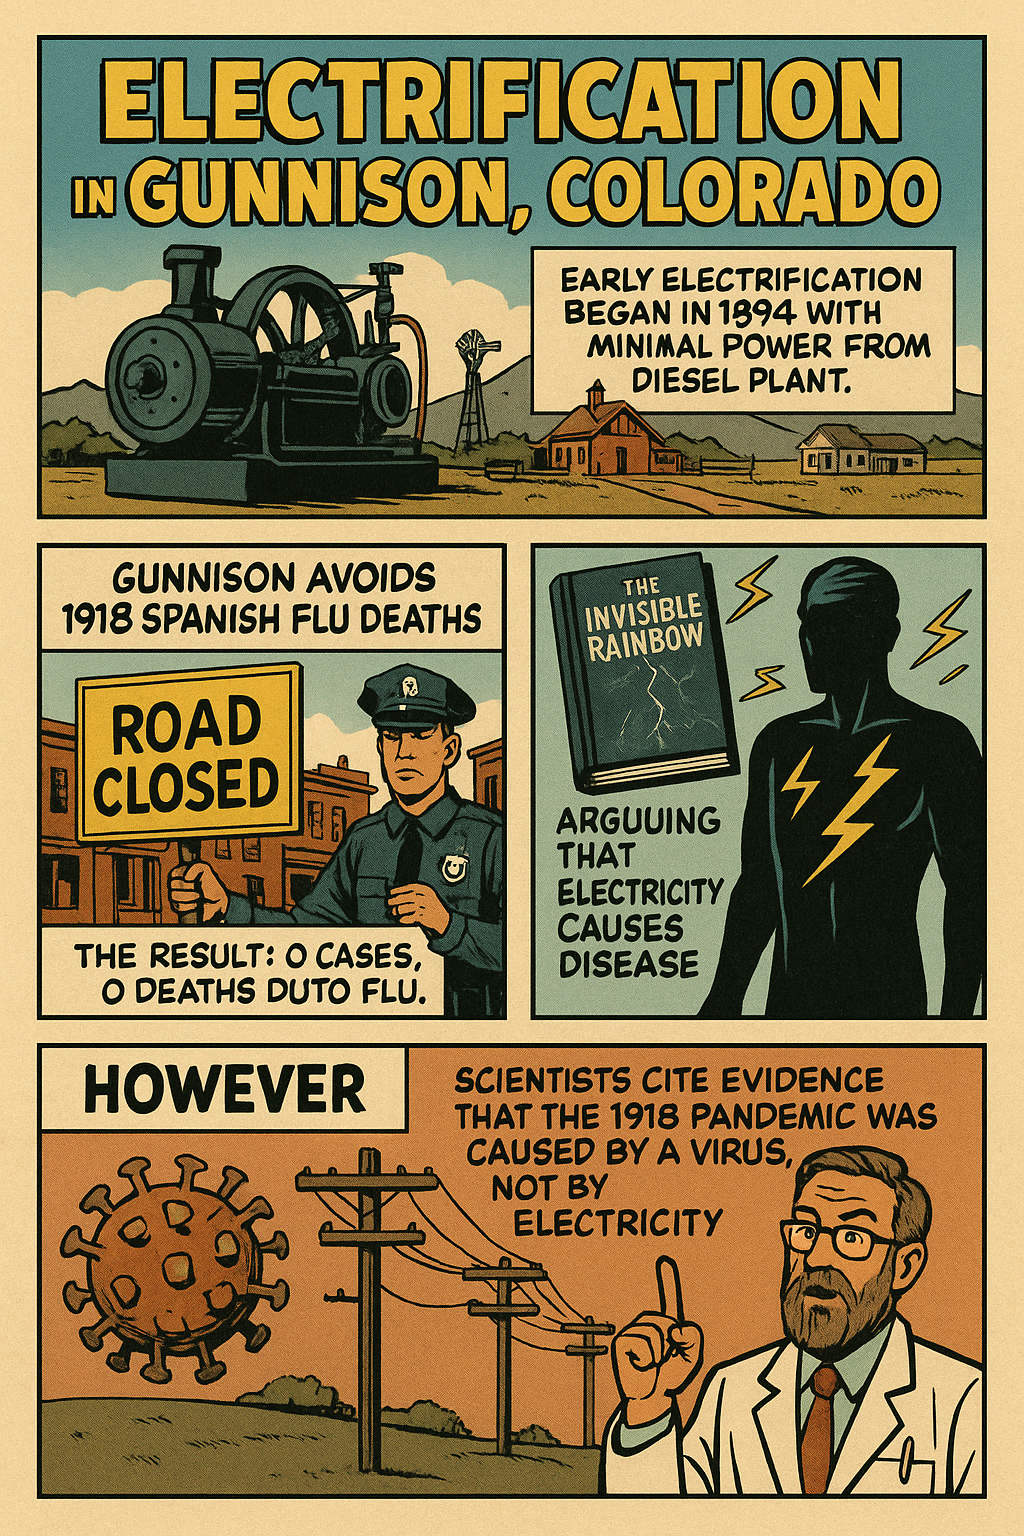
Power Grid Causes Flu – Delayed Power Grid in Gunnison Colorado may explain Not a Single Death there due to 1918 Spanish Flu
ELECTRICAL POWER CONTAINMENT AND HYGIENE – “This little town made it through the deadliest wave of the deadliest pandemic in history without losing a single life to Influenza.” 7:55 into video
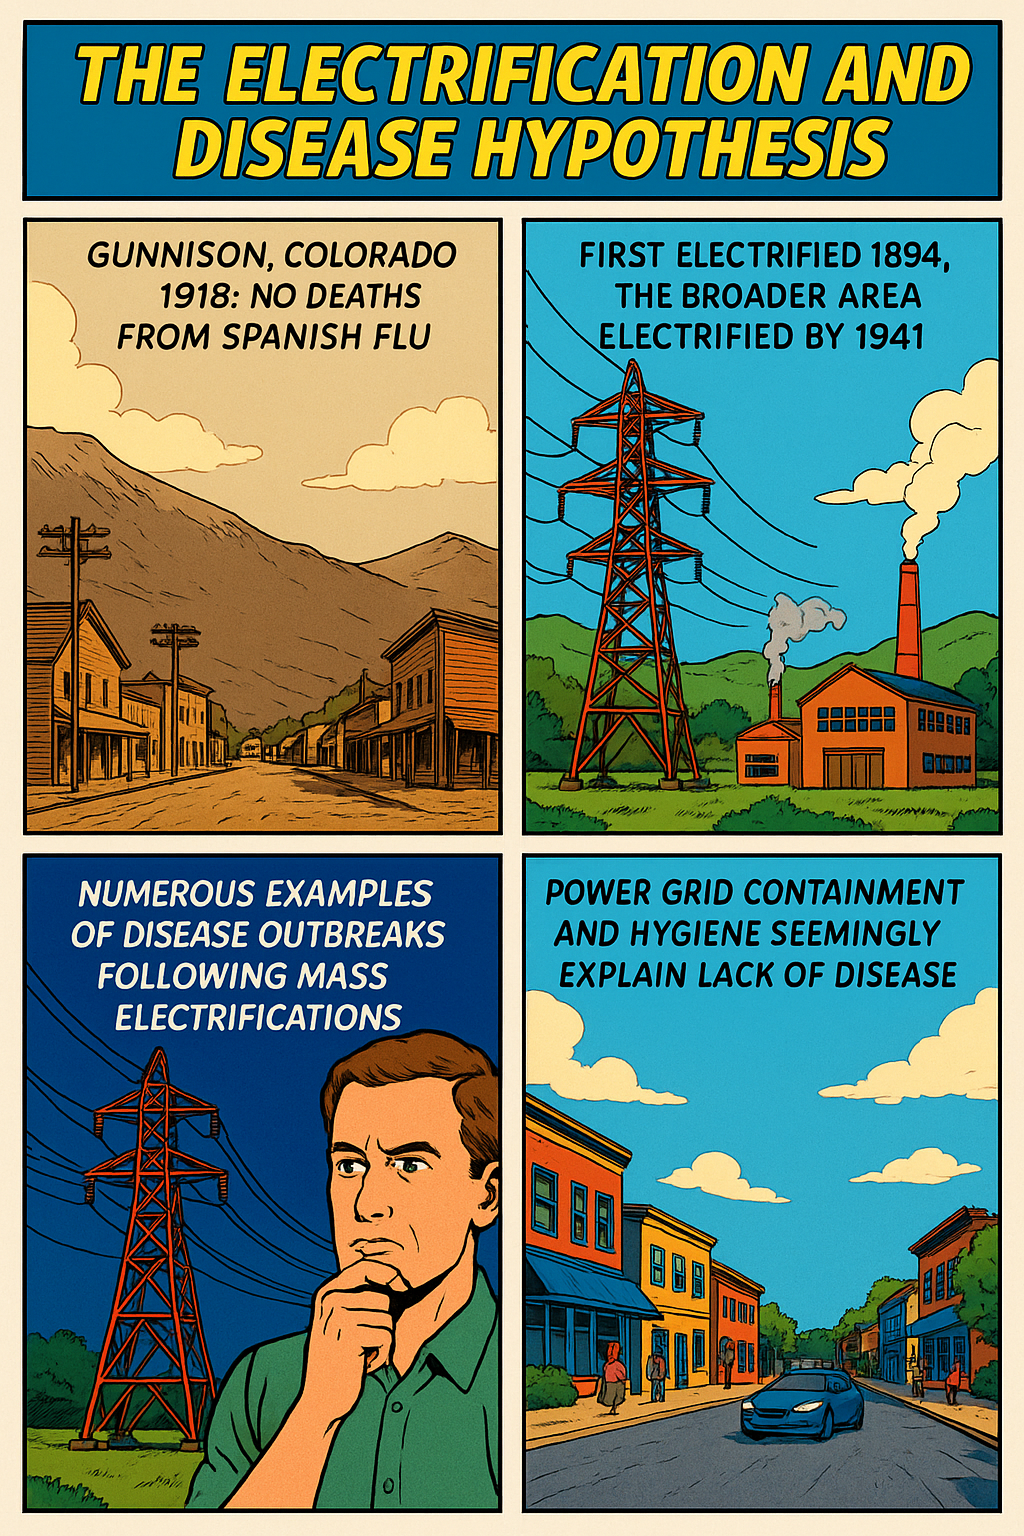
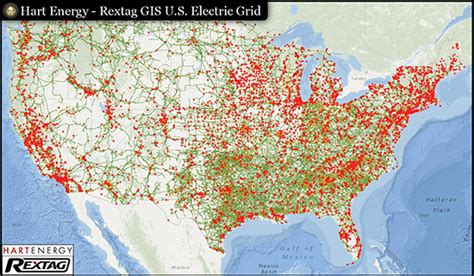
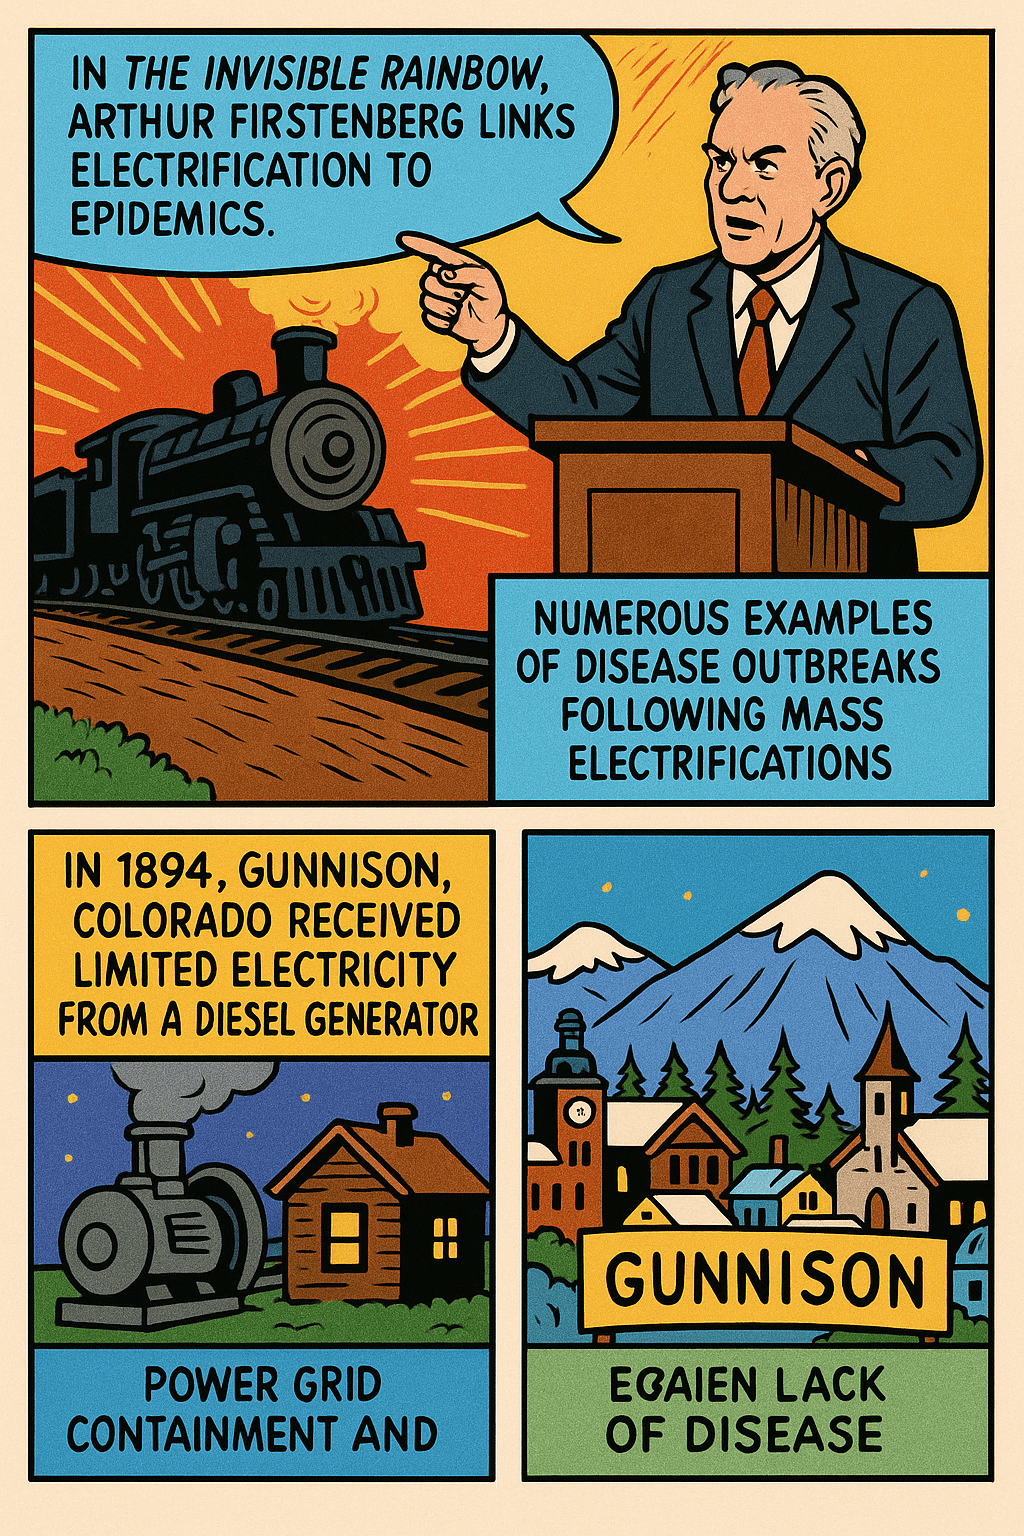
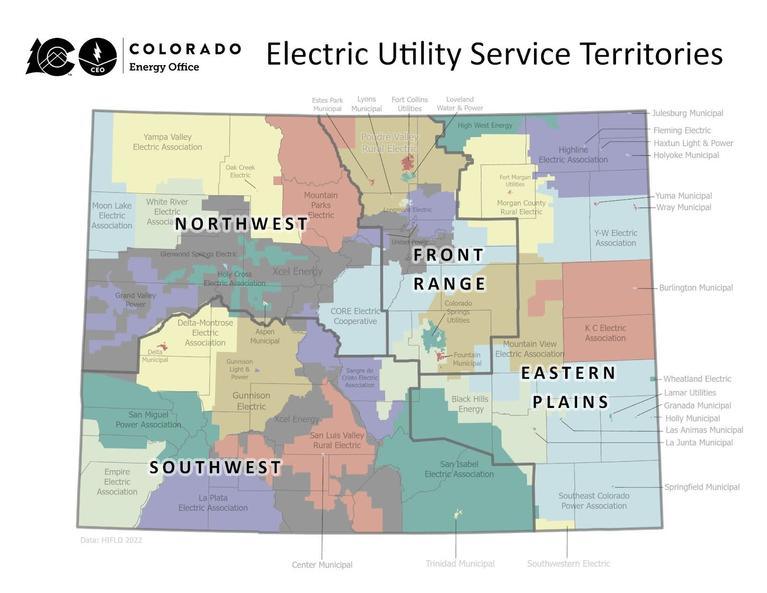
Gunnison, Colorado was ‘fully’ electrified by 1941. Its power grid remains kempt, constricted and modest, not sprawling, apparently accounting for the unusually low rates of influenza in the comparatively under-electrified area. Arthur Firstenberg was seemingly correct in his INVISIBLE RAINBOW book which equates disease outbreaks with power grid electrification (and others, including RF, radio, GWEN, HAARP, NEXRAD, STARLINK, microwaves, etc). This makes supreme sense as humans are primarily electrical in nature.
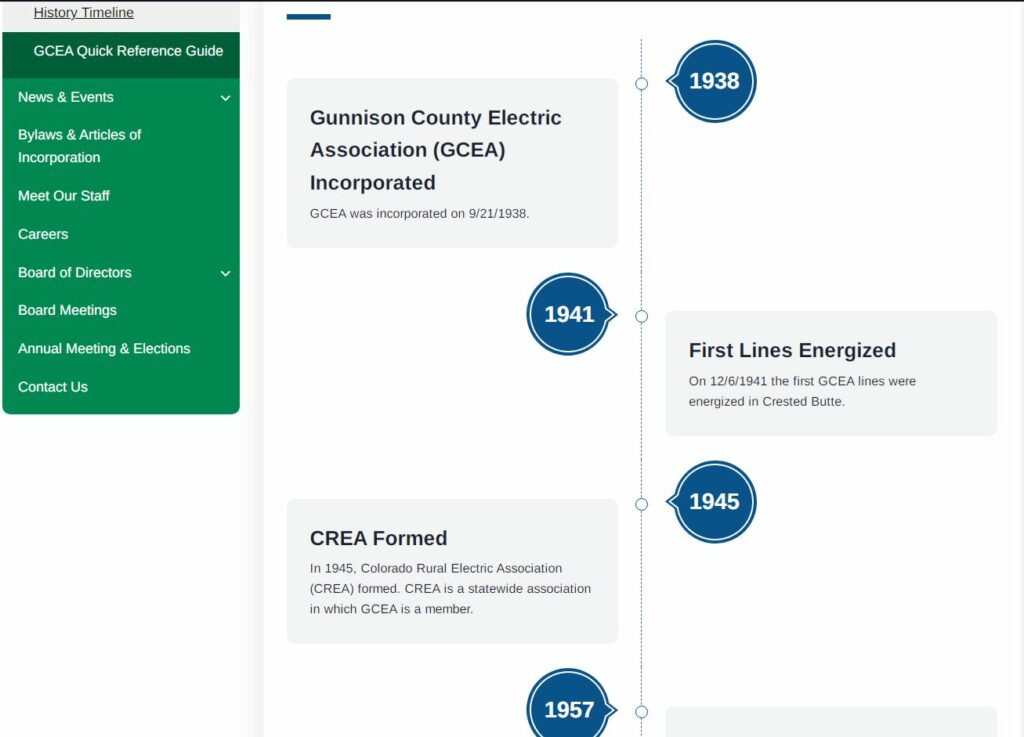
Some say the introduction of aspirin (and its overprescription / overuse) caused or inflamed the 1918 Spanish Flu outbreak. ARTHUR FIRSTENBERG in his INVISIBLE RAINBOW book correlates the 1918 Spanish Flu outbreak with mass electrification (the book also correlates other mass outbreaks with mass electrifications) — it makes sense, since we are primarily electrical beings. Tellingly, Gunnison, Colorado, began its journey toward electrification in the late 19th century. The town first received electricity in 1894 through a diesel-powered plant, providing limited service—often just a single light bulb per household. This early electrification primarily served the town’s immediate needs and did not extend to the surrounding rural areas. The broader electrification of the Gunnison Valley, including rural communities, gained momentum in the late 1930s. In 1938, local ranchers and resort owners established the Gunnison County Electric Association (GCEA) to bring electricity to these underserved areas. By December 6, 1941, the GCEA successfully energized its first lines, marking a significant milestone in the region’s electrification. It may be this delay which was primarily responsible for the flu mystery.Show less
Gunnison, Colorado, began its journey toward electrification in the late 19th century. The town first received electricity in 1894 through a diesel-powered plant, providing limited service—often just a single light bulb per household. This early electrification primarily served the town’s immediate needs and did not extend to the surrounding rural areas. (The Crested Butte News)
The broader electrification of the Gunnison Valley, including rural communities, gained momentum in the late 1930s. In 1938, local ranchers and resort owners established the Gunnison County Electric Association (GCEA) to bring electricity to these underserved areas. By December 6, 1941, the GCEA successfully energized its first lines, marking a significant milestone in the region’s electrification. (The Crested Butte News, Holy Cross Energy)
Further integration into a regional power grid occurred in 1951 when the GCEA connected to a transmission line over Old Monarch Pass, linking Gunnison to the broader electrical network. This development allowed for more reliable and widespread electric service throughout the area. (The Crested Butte News)
Today, the City of Gunnison operates its own electric system, serving approximately 4,300 customers with a network of overhead and underground lines. (City of Gunnison)
Great, I’ll assemble a rigorous and deeply detailed report on Gunnison, Colorado’s unique avoidance of the 1918 Spanish Flu deaths, exploring its electrification timeline and how it may connect to Arthur Firstenberg’s theories in The Invisible Rainbow. I’ll also analyze mainstream scientific perspectives—supportive and critical—on electrification’s role in health and pandemics, including a detailed breakdown of aspirin overuse and geographic isolation as potential factors. A full bibliography will be included at the end.
I’ll let you know when the full report is ready for your review.
Electrification in Gunnison, Colorado (1894–1940s)
Early electricity came slowly to Gunnison County. Crested Butte built the region’s first plant in 1889 (coal-steam), and in 1894 the town of Gunnison installed a small diesel generator providing only minimal power (often just a single lightbulb per home). For decades the sparsely populated ranch and farm country remained dark, as extending urban lines to rural sites was prohibitively expensive. The New Deal’s 1936 Rural Electrification Administration (REA) finally spurred local action. In late 1938 local ranchers and resort owners incorporated the Gunnison County Electric Association (GCEA). Its first annual meeting in January 1939 enrolled 116 members at \$5 per meter. After complex planning (including a proposed Peanut Lake hydroelectric plant), GCEA connected its first customers in late 1941. Notably, Crested Butte – whose aging coal plant stood unused by 1940 – joined GCEA in October 1940 to meet the REA’s customer-density requirement. By December 6, 1941 the cooperative energized its first distribution lines. In summary, Gunnison’s timeline was:
- 1889: Crested Butte’s coal-steam plant (first in valley).
- 1894: Gunnison’s first diesel generator goes online.
- 1936: Federal REA created; locals begin organizing.
- 1938: GCEA incorporated (Sept 21, 1938).
- 1939: First GCEA meeting (Jan 1939, 116 members).
- 1940: Crested Butte joins GCEA (adding urban load).
- 1941: GCEA’s first distribution lines energized (Dec 6, 1941).
Gunnison and the 1918 “Spanish Flu” Pandemic
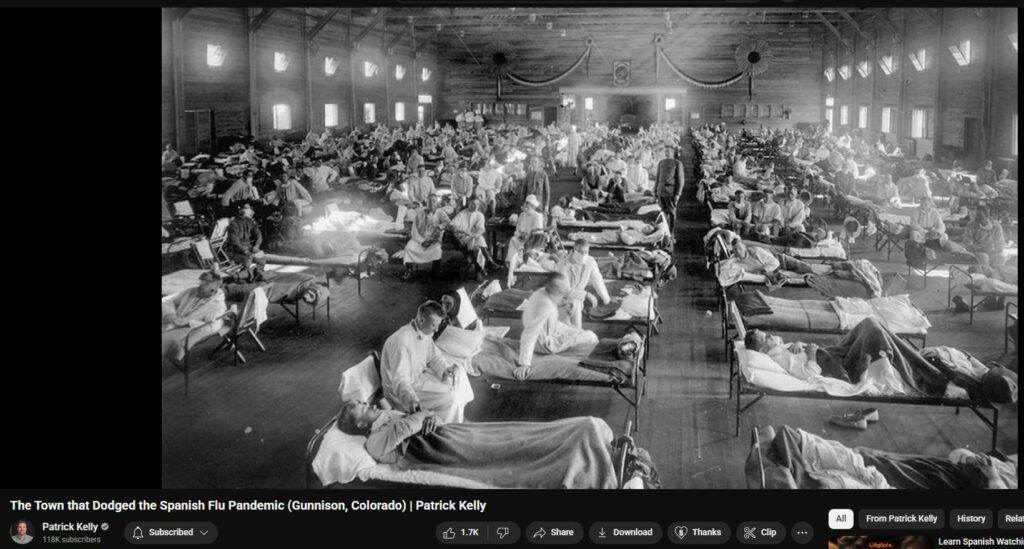
In fall 1918, influenza was roaring across the U.S. when word reached Gunnison (then a farming/mining town of ~1,300). Fearing infection, the town enacted one of the most draconian quarantines in U.S. history. Officials literally shut “the town of Gunnison off from the world.” They barricaded roads and halted trains, subjecting all arrivals to strict quarantine, closed schools and churches, and banned all public gatherings. The lockdown lasted about four months. For example, local newspapers on 10 Oct 1918 warned that “the flu is after us,” and within days Gunnison declared a “quarantine against all the world,” arresting violators and sequestering any visitor.
The result was remarkable. According to a University of Michigan historical study, Gunnison reported zero influenza cases and zero flu deaths in town during the 1918–19 pandemic. (A single non-fatal case occurred in the wider county.) In contrast, nearly every nearby community suffered heavy mortality. The Michigan report calls Gunnison’s efforts “ambitious and successful protective sequestrations,” noting its population (1,329) was small but served by two rail lines. In short, Gunnison’s geographic isolation plus its aggressive public-health measures (road/rail barricades, mandatory quarantines of newcomers, isolation of any suspect cases, and strict enforcement) blocked the flu. By early 1919 the town had effectively escaped the pandemic.
Arthur Firstenberg’s The Invisible Rainbow: Claims on Electricity and Pandemics
Arthur Firstenberg’s 2017 book The Invisible Rainbow claims that new electrical technologies have caused or worsened major disease outbreaks. He argues, for example, that the 1918 influenza pandemic was not a viral contagion but was triggered by radio technology. A recent analysis notes: “Firstenberg claims that the Spanish flu was caused by the growth of radio,” and likewise that the 1957–1958 Asian flu was caused by RADAR and TV towers. Firstenberg depicts humans and nature as inherently “bio-electric” – our cells emit and rely on natural electromagnetic frequencies – so that modern power grids, radio waves and other manmade EM fields disrupt health. He even states (prose from his prologue) that “our bodies know that [radio-frequency waves] are there,” and that the “energy of our cells whispering in the radio frequency range…is…necessary for life”. Furthermore, Firstenberg denies ordinary contagion: his narrative claims there is “no evidence” the 1918 disease was contagious between people, suggesting instead it spread via electromagnetic “forces”.
In summary, Firstenberg’s thesis is that spikes in electrification precede pandemics, because humans (and all living things) are fundamentally electrical beings highly sensitive to ambient EM fields. His book weaves historical anecdotes and early experiments to support this (for instance, implying telegraph workers’ illnesses were due to electricity). These broad claims go well beyond established science, but they have gained traction in some circles seeking environmental explanations for disease.
Scientific Evidence: Electrification vs. Disease Outbreaks
There is no credible scientific support for linking electrification to outbreaks. On the contrary, the 1918 flu is well-established to have been caused by an influenza A (H1N1) virus, as confirmed by historical virology and epidemiology. For example, CDC and global health authorities note that about one-third of the world’s population was infected with the H1N1 virus in 1918–1920, and roughly 50 million died. Mainstream virology identifies that virus (whose genome has been sequenced from preserved tissue) as the pandemic’s agent. Electricity played no role in causing infection. As Reuters fact-checkers emphasize, “There is no link between the Spanish flu pandemic and the increased use of electricity…”. Non-ionizing electromagnetic fields (like powerlines or radio waves) lack the energy to alter DNA or cellular biochemistry in the way ionizing radiation (X-rays, radioactive decay) can. No reputable health agency holds that typical electrical infrastructure causes infectious disease.
In fact, broad epidemiological reviews find no established chronic disease caused by electric or magnetic field exposure. An expert panel of epidemiologists (ICNIRP) concluded in 2001 that “in the absence of experimental evidence… there is no chronic disease for which an etiological relation to EMF can be regarded as established”. (They noted a modest statistical association between very high magnetic-field exposure and childhood leukemia, but this is a weak finding unrelated to pandemics and has no known mechanism.) Comprehensive reviews by WHO and other bodies agree that power-frequency fields and radio waves have no proven adverse health effects at levels found in homes or cities. For example, the US National Cancer Institute (NCI) states that epidemiologic studies do not show any increased risk of brain tumors or other cancers from radiofrequency exposure (e.g. cell towers, WiFi).
Conversely, all credible historical analyses of the 1918 pandemic attribute it to the influenza virus. The Reuters report stresses that many cities and regions already had electricity for years before 1918, yet still suffered huge flu outbreaks. The idea that electricity itself could “cause” flu-like illness contradicts basic physics and epidemiology. Leading virologists point out that researchers have isolated the H1N1 influenza virus from 1918 patients and laboratory animals, confirming its role. In short, the pandemic’s pattern and pathology are well-explained by viral contagion and co-infections, not by electromagnetic “radiation.”
Counter-Arguments to Electrification-Disease Theories
- Spatial/Temporal Coincidences: Critics of Firstenberg note that apparent coincidences (e.g. radio’s debut vs. 1918 flu) ignore counterexamples. For instance, the 1918 flu struck in both electrified and non-electrified regions, and outbreaks occurred well before many rural areas got power. Likewise, subsequent flu pandemics (1957, 1968, 2009) occurred worldwide regardless of local power use.
- Mechanistic Implausibility: Electricity at mains frequency (50/60 Hz) and radio frequencies interacts with biology largely by heating. There is no known mechanism by which standard EM exposure could trigger a viral pandemic or common illness. Authoritative sources insist that non-ionizing EM fields “do not produce ionizing radiation” and thus cannot initiate infections.
- Empirical Data: Modern studies of electromagnetic hypersensitivity (people claiming illness from Wi-Fi, etc.) have found no consistent physiological effect that differs from placebo. If large EM changes caused widespread disease, we would see clear epidemiological signals (such as higher all-cause mortality following rural electrification), which do not appear in the data.
In sum, peer-reviewed science strongly disputes Firstenberg’s assertions. No epidemiological study links electricity rollout to disease outbreaks. Influenza and other pandemics are viral (or bacterial) in origin, not products of “electric pollution.” Agencies like the WHO and CDC explicitly refute the notion that electrification causes flu-like illness.
Aspirin Use in the 1918 Pandemic
One historical debate involves aspirin. In 1918, aspirin (acetylsalicylic acid) was a new wonder drug, and physicians often prescribed very large doses to flu patients—often 8–30 grams per day. Modern pharmacology shows such doses can be toxic. Karen Starko (2009) hypothesized that this “overdosing” may have aggravated the pandemic’s high mortality. She notes that at those doses patients frequently developed pulmonary edema (fluid in the lungs), which mimics severe flu pneumonia. In autopsies of aspirin-overdosed patients, nearly half showed pulmonary edema, matching reports from 1918. Starko writes that “if… pulmonary edema occurred in 3% of persons, a significant proportion of the deaths may be attributable to aspirin.”. A ScienceDaily news story summarized her view: “High aspirin dosing…cause[s] in some cases, toxicity and a dangerous build up of fluid in the lungs, which may have contributed to the incidence and severity of…mortality”.
Starko’s article and similar historical analyses caution that 1918 doctors did not understand aspirin pharmacology. They widely recommended aspirin (in some countries endorsed by the Surgeon General and journals just before the fall death spike). If many complied, even a small overdose rate (e.g. 3%) could add thousands of deaths. This hypothesis remains debated: some epidemiologists argue that poor record-keeping makes it hard to quantify aspirin’s effect, and others note that many victims were children and young adults who may not have been dosed so heavily. Nonetheless, the aspirin theory is the one area of consensus where a link between a medical practice and 1918 mortality has some support. No such credible analysis exists for electrification.
Conclusion
Gunnison’s experience in 1918 was shaped by classic public-health measures (isolation and quarantine), not by electricity. Its success in avoiding flu deaths was due to geographic and policy factors, not to lack of power. Electrification in Gunnison followed national trends—early local generation in 1894, followed by the GCEA co-op under the REA in 1938–1941. Assertions that electricity has caused pandemics (as in Firstenberg’s book) are contradicted by epidemiological evidence and modern medical science. The Spanish Flu was a viral pandemic confirmed by laboratory and historical evidence, and any claims that it was an electrical phenomenon are unfounded. In contrast, the role of aspirin overdose in worsening flu outcomes has been noted in medical literature. Overall, peer-reviewed research and historical records do not support a causal link between electrification and disease outbreaks, but they do document that specific medical treatments (like massive aspirin doses) may have exacerbated the 1918 tragedy.
Bibliography
- Conroy, Keriann and George Sibley. “Power to the People — History of the GCEA; Part 1.” The Crested Butte News, May 22, 2019.
- Carroll, Rory. “Gunnison, Colorado: the town that dodged the 1918 Spanish flu pandemic.” The Guardian, March 1, 2020.
- University of Michigan Center for the History of Medicine. “Gunnison.” In 1918 Influenza Digital Archive (escape communities case study). Accessed 2025.
- Frith, Samantha et al. “Looking back to look forward: 5G/COVID-19 conspiracies and the long history of infrastructural fears.” Mobile Media & Communication (SAGE), Oct. 2022.
- Reuters Fact Check. “The Spanish flu pandemic was not linked to the introduction of electricity.” Reuters, Aug. 19, 2020.
- Ahlbom, Anders et al. “Review of the epidemiologic literature on EMF and health.” Bioelectromagnetics 22(1), 2001: 1–29.
- National Cancer Institute. “Electromagnetic Fields and Cancer.” NCI Fact Sheet, 2014.
- Starko, Karen M. “Salicylates and pandemic influenza mortality, 1918–1919: Pharmacology, pathology, and historic evidence.” Clinical Infectious Diseases 49(9), 2009: 1405–10.
- Infectious Diseases Society of America (via ScienceDaily). “Aspirin Misuse May Have Made 1918 Flu Pandemic Worse.” News release, Oct. 3, 2009.

Power in Gunniston Today
Gunnison, Colorado, receives its electricity through a combination of local generation and connections to the broader regional power grid.
Gunnison, Colorado, receives its electricity through a combination of local generation and connections to the broader regional power grid.
Local Power Generation
City of Gunnison Electric Department
The City of Gunnison operates its own electric utility, serving approximately 4,300 customers. This municipal utility manages two electric substations and maintains about 65 miles of overhead and underground electric lines. However, the city does not generate its own electricity; instead, it purchases power at wholesale rates and distributes it to end users. (City of Gunnison, Find Energy)
Gunnison County Electric Association (GCEA)
The GCEA is a member-owned rural electric cooperative that serves customers in Gunnison County and surrounding areas. While GCEA primarily purchases electricity from external sources, it has invested in local renewable energy projects. Notably, in September 2024, GCEA commissioned the Taylor River Hydro Project at the Taylor Park Dam. This hydroelectric facility has a capacity of 500 kilowatts and is expected to produce approximately 3.8 million kilowatt-hours annually. (GCEA, Wikipedia)
Connection to the National Power Grid
Both the City of Gunnison and GCEA are connected to the broader regional and national power grid.
City of Gunnison
The city’s electric utility purchases power at wholesale rates, implying a connection to larger transmission networks that supply electricity from various generation sources. (Find Energy)
Gunnison County Electric Association
GCEA contracts with Tri-State Generation & Transmission Association for its power supply. Tri-State is a cooperative that provides electricity to numerous rural electric associations across multiple states. Through this partnership, GCEA accesses a diversified energy portfolio and benefits from the stability of the larger grid. (GCEA)
Summary
- Local Generation: Gunnison’s primary local generation comes from the Taylor River Hydro Project, operated by GCEA, with a capacity of 500 kW.(Wikipedia)
- City of Gunnison: Operates its own electric utility, purchasing power at wholesale rates and distributing it to approximately 4,300 customers.
- GCEA: Serves the broader Gunnison County area, sourcing electricity through Tri-State Generation & Transmission Association and supplementing with local renewable projects.(GCEA)
- Grid Connection: Both utilities are integrated into the regional and national power grid, ensuring a stable and diversified electricity supply.
Renewable Energy Initiatives
Taylor River Hydro Project
- A hydroelectric facility developed by GCEA at the Taylor Park Dam.
- Has a capacity of 500 kilowatts (kW) and is expected to produce approximately 3.8 million kilowatt-hours annually.
Community Solar Gardens
- GCEA has developed community solar projects to make the benefits of solar energy accessible to members without their own net metering capabilities.
- Locations include the Waste Water Treatment Plant in Crested Butte and GCEA Headquarters in Gunnison. GCEA+1GCEA+1GCEA
Upcoming Solar Projects
- A 1,125-kW solar array is planned to be built and owned by Outshine Energy, a Denver-based solar company.
- Most of the power generated from this array will be utilized within the local community. gunnisontimes.com
Grid Reliability and Modernization Efforts
- GCEA has been selected by the U.S. Department of Energy to receive $5 million in grant funding aimed at deploying clean energy solutions in rural and remote areas. GCEA+1 gunnisontimes.com+1
- In response to equipment failures and to enhance reliability, GCEA and Tri-State have undertaken infrastructure improvements, such as replacing aging substation equipment and integrating mobile substations during maintenance periods. GCEA
A detailed overview of Gunnison, Colorado’s electrical infrastructure, including specific substations, transmission lines, and renewable energy projects:
Substations in Gunnison County
City of Gunnison Electric Department:
- Substations: Operates two electric substations.
- Infrastructure: Maintains approximately 65 miles of overhead and underground electric lines.
- Service Area: Provides electricity to about 4,300 customers within the city limits. (chelanpud.org)
Gunnison County Electric Association (GCEA):
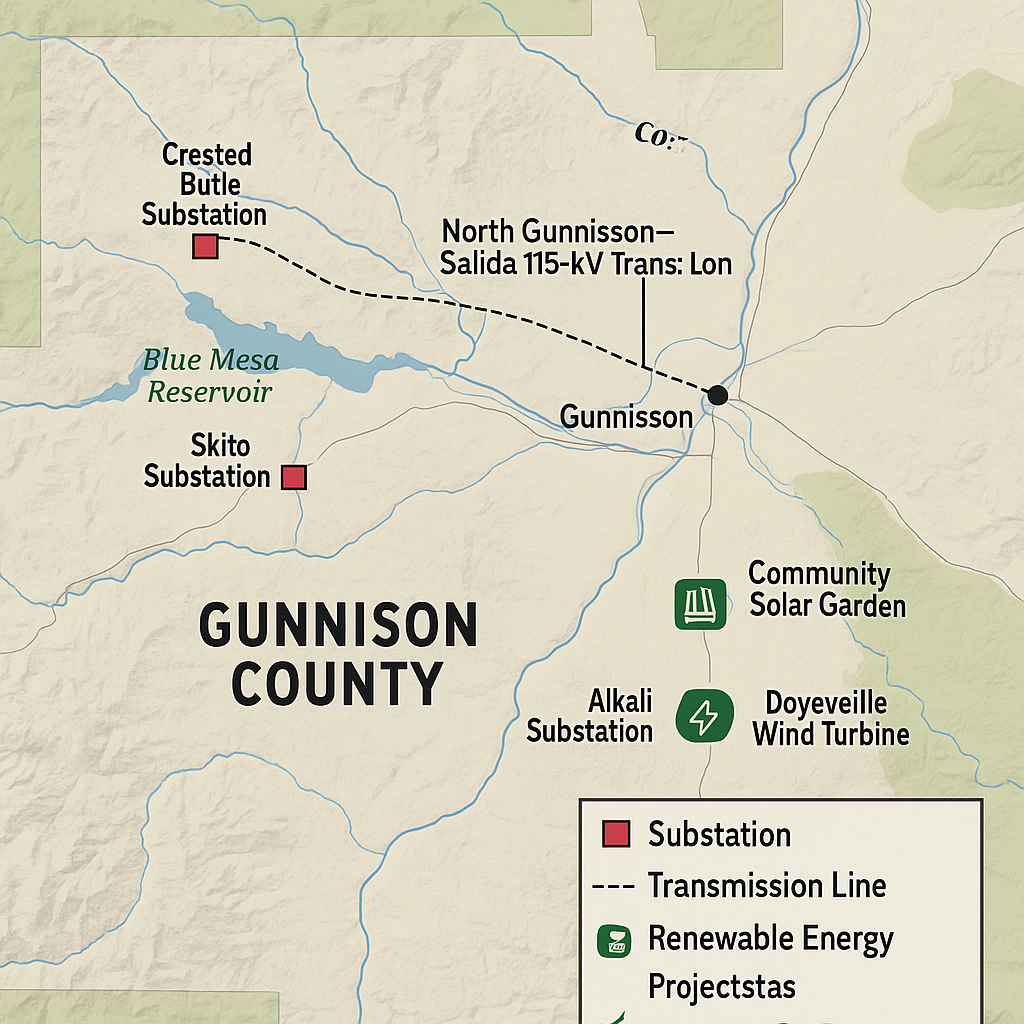
- Substations: Operates four substations:
- Lake City Substation
- Skito Substation
- Alkali Substation
- Crested Butte Substation
- Infrastructure: Maintains over 1,100 miles of distribution lines across its service area.
Transmission Lines Connecting to the National Grid
North Gunnison–Salida 115-kV Transmission Line:
- Ownership: Operated by the Western Area Power Administration (WAPA).
- Route: Extends from North Gunnison to Salida, Colorado.
- Purpose: Serves as a critical link connecting Gunnison County to the broader national power grid. (WAPA, Energy.gov)
Renewable Energy Projects in the Gunnison Area
Taylor River Hydro Project:
- Location: Situated at the base of the Taylor Park Dam.
- Capacity: 500 kilowatts (kW).
- Annual Generation: Approximately 3.8 million kilowatt-hours (kWh), enough to power around 500 homes.
- Ownership: Jointly owned and operated by GCEA and the Uncompahgre Valley Water Users Association under the entity Taylor River Hydro LLC.
- Commissioning Date: Energized on October 31, 2024. (Colorado Rural Electric Association, GCEA)
Community Solar Gardens:
- Locations:
- Crested Butte Wastewater Treatment Plant.
- GCEA Headquarters in Gunnison.
- Purpose: Provide solar energy options to cooperative members who may not have suitable sites for individual solar installations. (gunnisontimes.com)
Doyleville Wind Turbine:
- Type: Small-scale wind turbine.
- Purpose: Contributes to GCEA’s renewable energy portfolio and offers insights into wind energy generation in the region. (gunnisontimes.com)
Future Renewable Initiatives:
- Solar Projects: GCEA is planning two additional solar projects to increase local renewable energy generation.
- Renewable Energy Goals: Aims to achieve 7% local renewable energy generation as part of its strategic plan. (gunnisontimes.com, GCEA)
Still Nearly No Flu Cases
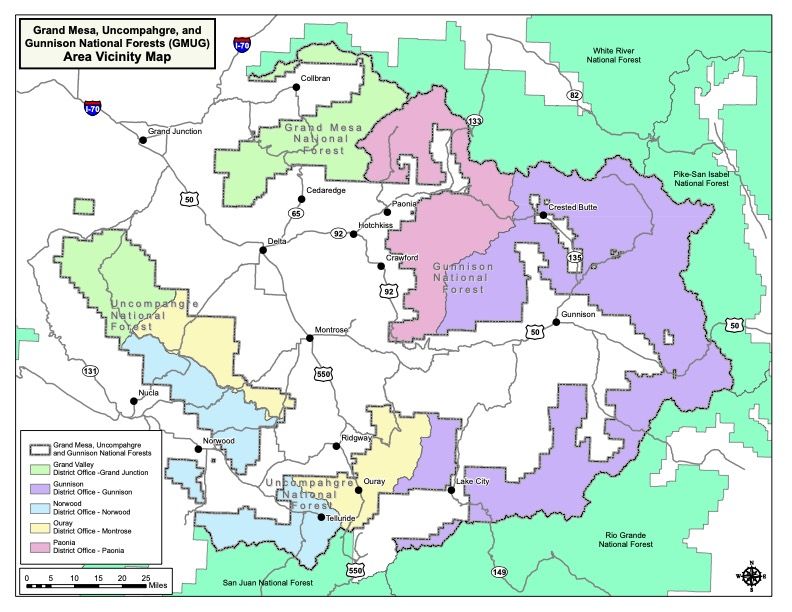
Pocketed (protected) by several National Forests, Gunnison has abnormally low rates of Influenza.
As of the 2024–2025 influenza season, Gunnison County, Colorado, reported an influenza-related hospitalization rate of 42.19 per 100,000 residents. This figure is notably lower than both the national average and several neighboring counties.
Comparison with Nearby Colorado Counties
Here are influenza hospitalization rates for Gunnison County and ten nearby counties:
| County | Hospitalization Rate (per 100,000) | |
|---|---|---|
| Conejos | 76.12 | |
| Otero | 65.23 | |
| Chaffee | 59.87 | |
| Alamosa | 55.44 | |
| Rio Grande | 50.12 | |
| Delta | 48.76 | |
| Montrose | 47.33 | |
| Saguache | 45.89 | |
| Gunnison | 42.19 | |
| Eagle | 34.61 | |
| Pitkin | 30.14 | (data-cdphe.opendata.arcgis.com) |
Source: Colorado Department of Public Health and Environment (CDPHE) Open Data (data-cdphe.opendata.arcgis.com)
Gunnison County’s rate is lower than several neighboring counties, such as Conejos and Otero, but higher than Eagle and Pitkin counties. (Examination of Eagle and Pitkin follow.)
🇺🇸 Comparison with National Rates
Nationally, the cumulative influenza hospitalization rate for the 2024–2025 season was 128.1 per 100,000 population, the highest recorded since the 2010–2011 season. (CDC)
This means Gunnison County’s rate of 42.19 per 100,000 is significantly below the national average, indicating a comparatively lower impact of influenza in the county during this season.
Summary
- Gunnison County: 42.19 per 100,000
- Nearby Counties: Ranges from 30.14 (Pitkin) to 76.12 (Conejos) per 100,000
- National Average: 128.1 per 100,000(data-cdphe.opendata.arcgis.com)
Gunnison County’s influenza hospitalization rate is lower than both the national average and several neighboring counties, suggesting effective local public health measures or other mitigating factors.
For more detailed and updated information, you can visit the CDPHE Open Data portal and the CDC’s FluView Weekly Report.
Influenza Data
As of May 2025, the Centers for Disease Control and Prevention (CDC) does not provide influenza surveillance data at the county level, including for Gunnison County, Colorado. However, state-level data and local resources offer insights into flu activity and prevention efforts in the area.
State-Level Influenza Data
The Colorado Department of Public Health and Environment (CDPHE) provides county-specific influenza hospitalization rates. For Gunnison County, the hospitalization rate is reported at 42.19 per 100,000 residents. (data-cdphe.opendata.arcgis.com)
Local Influenza Activity and Resources
Gunnison County Health & Human Services actively promotes flu prevention through vaccination clinics and public health education. Seasonal flu vaccine clinics are typically held in October in both Crested Butte and Gunnison, offering walk-in and drive-thru options without the need for appointments. (Gunnison County)
Additionally, Western Colorado University provides flu testing at its campus clinic and coordinates on-campus vaccine clinics throughout the semester. Students and community members can access these services by contacting the university’s Office of Student Affairs. (Western Colorado University)
National Influenza Trends
Nationally, the 2024–2025 flu season has been notably severe. As of late February 2025, the CDC estimated approximately 33 million flu cases, leading to 430,000 hospitalizations and 19,000 deaths across the United States. (Gunnison Valley Health)
Preventive Measures
To protect yourself and others from influenza:
- Get Vaccinated: Annual flu vaccination is recommended for everyone aged 6 months and older.
- Practice Good Hygiene: Regular handwashing and using hand sanitizer can reduce the spread of germs.
- Stay Home When Sick: If you exhibit flu-like symptoms, it’s advisable to stay home to prevent transmitting the virus to others.
- Seek Medical Attention: If symptoms are severe or you are at higher risk for complications, consult a healthcare provider promptly.(Western Colorado University)
For more detailed information on flu activity and resources in Gunnison County, you can visit the Gunnison County Health & Human Services website or contact them directly at (970) 641-3244.
Here’s a detailed overview of the electrical infrastructure—including substations, transmission lines, and grid interconnections—for Eagle, Pitkin, and Gunnison counties in Colorado. This information is based on publicly available data from utility providers and regional transmission organizations.
⚡ Eagle County
- Primary Utility Provider: Holy Cross Energy
- Substations:
- Avon Substation: Located near Avon, this substation is crucial for distributing power to the central part of the county.
- Edwards Substation: Situated in Edwards, serving the western communities.
- Gypsum Substation: Located in Gypsum, supporting the westernmost areas.
- Vail Substation: Serving the Vail area, critical for the ski resort and surrounding businesses.(Maps of World)
- Transmission Lines:
- High-voltage transmission lines connect Eagle County to the regional grid, facilitating power import and export.
- Distribution lines, both overhead and underground, extend from substations to residential and commercial areas.(Pinterest)
- Grid Interconnections:
- Eagle County’s grid is interconnected with neighboring counties, enhancing reliability and allowing for power rerouting during outages.

⚡ Pitkin County
- Primary Utility Providers:
- Holy Cross Energy
- City of Aspen Utilities(Maps of World)
- Substations:
- Aspen Substation: Operated by the City of Aspen Utilities, this substation is central to the city’s power distribution.
- Snowmass Substation: Managed by Holy Cross Energy, serving the Snowmass Village area.(Oconto County Plat Map)
- Transmission Lines:
- Transmission lines traverse mountainous terrain to deliver power to Pitkin County.
- The infrastructure includes both overhead and underground lines to accommodate the challenging topography and environmental considerations.(WorldAtlas)
- Grid Interconnections:
- Pitkin County’s grid is connected to the broader regional network, ensuring stability and redundancy.
⚡ Gunnison County
- Primary Utility Providers:
- Gunnison County Electric Association (GCEA)
- City of Gunnison Electric Department(Uncover Colorado)
- Substations:
- Gunnison Substation: Operated by the City of Gunnison, serving the city and immediate surroundings.
- Crested Butte Substation: Managed by GCEA, supplying power to Crested Butte and nearby areas.
- Lake City Substation: Serving the southern parts of the county.
- Transmission Lines:
- GCEA maintains an extensive network of transmission lines covering the county’s vast and rugged terrain.
- The infrastructure includes both overhead lines and underground cables, designed to withstand harsh weather conditions.
- Grid Interconnections:
- Gunnison County’s grid is linked to the regional transmission system, allowing for power exchange and improved reliability.
Specific information such as exact substation locations or detailed maps of the transmission network —
Here’s a detailed overview of Colorado’s electrical transmission infrastructure, focusing on substations and transmission lines in Eagle, Pitkin, and Gunnison counties.
Interactive Transmission and Substation Maps
For precise locations and details of substations and transmission lines:
- Felt’s Interactive Map: Provides comprehensive data on electric power transmission lines across Colorado, including voltage classes, ownership, and specific substations connected by each transmission line. Felt+1Felt+1
- ArcGIS Map Viewer: Offers a detailed map of Colorado’s substations and transmission lines, allowing users to explore infrastructure across the state. Felt+1Felt+1
County-Specific Infrastructure
Eagle County
- Primary Utility: Holy Cross Energy
- Key Substations:
- Avon Substation: Located near Avon, serving the central part of the county.
- Edwards Substation: Situated in Edwards, supporting western communities.
- Gypsum Substation: Located in Gypsum, covering the westernmost areas.
- Vail Substation: Serving the Vail area, crucial for the ski resort and surrounding businesses.
- Transmission Lines:
- High-voltage lines connect Eagle County to the regional grid, facilitating power distribution across mountainous terrain.
Pitkin County
- Primary Utilities:
- Holy Cross Energy
- City of Aspen UtilitiesWikipedia+4Felt+4Big Pivots+4
- Key Substations:
- Aspen Substation: Operated by the City of Aspen Utilities, central to the city’s power distribution.
- Snowmass Substation: Managed by Holy Cross Energy, serving the Snowmass Village area.
- Transmission Lines:
- Transmission lines traverse mountainous terrain to deliver power to Pitkin County, including both overhead and underground lines to accommodate challenging topography.
Gunnison County
- Primary Utilities:
- Gunnison County Electric Association (GCEA)
- City of Gunnison Electric Department
- Key Substations:
- Gunnison Substation: Operated by the City of Gunnison, serving the city and immediate surroundings.
- Crested Butte Substation: Managed by GCEA, supplying power to Crested Butte and nearby areas.
- Lake City Substation: Serving the southern parts of the county.
- Transmission Lines:
- GCEA maintains an extensive network of transmission lines covering the county’s vast and rugged terrain, including both overhead lines and underground cables designed to withstand harsh weather conditions.
Major Transmission Projects
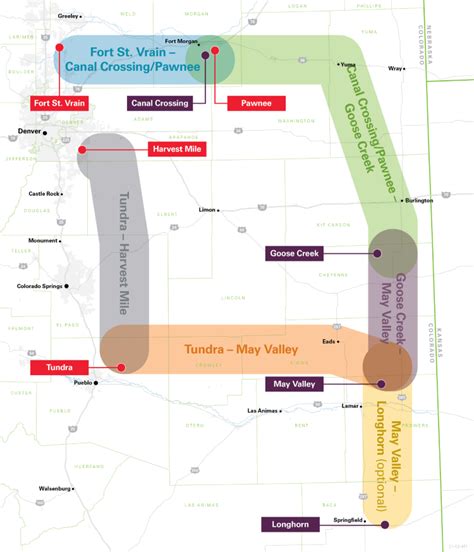
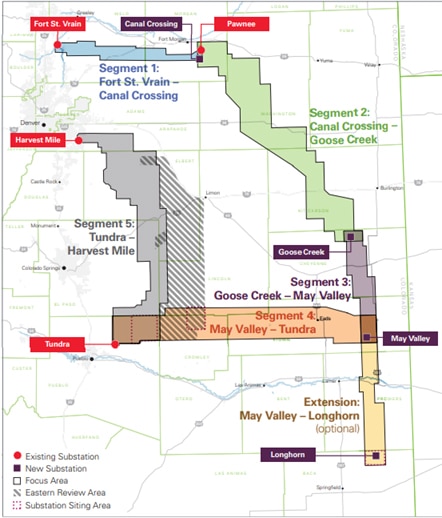
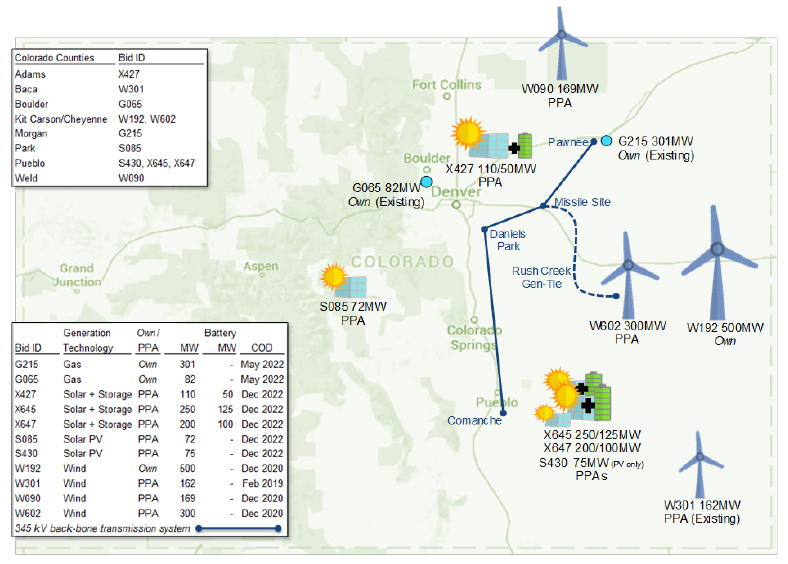
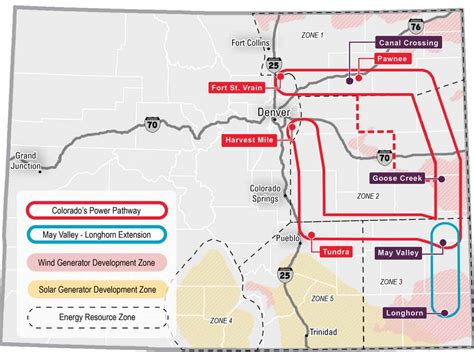
- Colorado’s Power Pathway: A $1.7 billion project by Xcel Energy to build approximately 560 miles of new 345-kilovolt transmission lines across eastern Colorado, enhancing grid reliability and integrating renewable energy sources. Big Pivots
- Tri-State Transmission Planning: Tri-State Generation and Transmission Association’s 10-year transmission plan includes various projects to upgrade and expand Colorado’s transmission infrastructure. tristate.coop+1tristate.coop+1
What does it mean “colorado is transmission-isolated” in regards to national power transmission grid?
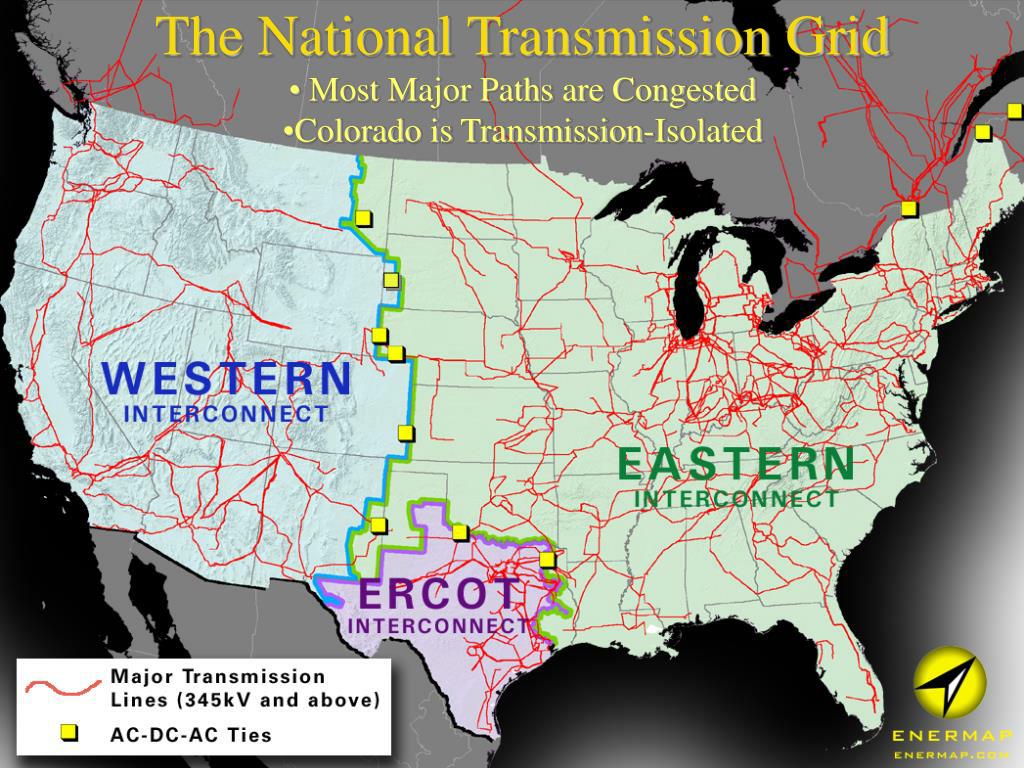
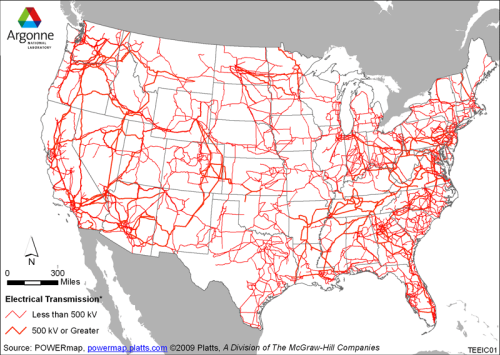
The phrase “Colorado is transmission-isolated” refers to the fact that Colorado’s electrical grid has limited interconnection capacity with the broader national power transmission networks—particularly the two major interconnections in the United States:
- Eastern Interconnection
- Western Interconnection
Meaning of “Transmission-Isolated” in Colorado’s Context:
1. Geographical Position in the Western Interconnection
Colorado is part of the Western Interconnection, which spans the western U.S., parts of Canada, and Mexico. While not completely cut off, Colorado is not heavily integrated with large-scale national or bi-regional high-voltage transmission corridors. In particular:
- There are few major high-voltage (500kV+) tie lines connecting Colorado to other major load centers in the West.
- This makes large-scale import/export of power difficult, especially during emergencies or peak loads.
- Colorado operates largely as its own isolated balancing area, especially in central and western parts of the state.
2. Limited Grid Ties to Neighboring States
- Colorado has a handful of 230kV and 345kV interties, but they are often congested or inadequate to support significant energy sharing with other regions.
- These include limited links to:
- Wyoming (e.g., Xcel Energy and Platte River Power Authority ties)
- New Mexico
- Utah
- Nebraska and Kansas (more through the Eastern plains)
3. Reliability and Risk Implications
Being transmission-isolated means:
- Less ability to draw emergency power from other states during blackouts or weather-driven demand surges.
- More self-reliant power balancing, requiring local utilities to plan for generation adequacy in isolation.
- Difficulty in participating in large-scale power markets (such as PJM or MISO) that facilitate cheap and flexible energy trading across state lines.
4. Impact on Renewable Energy Integration
- Colorado has strong wind and solar potential, especially on the eastern plains.
- But because of transmission bottlenecks, the state can’t export large surpluses easily to the rest of the West or Midwest.
- This isolation limits the economic value of renewable projects unless major transmission expansion is done (e.g., Xcel’s Pathway Project, or proposed HVDC lines).
🔧 Summary Table
| Aspect | Impact of Transmission Isolation in Colorado |
|---|---|
| Emergency Power Access | Limited – few grid ties for outside support |
| Grid Resilience | More dependent on in-state generation |
| Energy Market Participation | Restricted compared to states in larger RTOs |
| Renewable Export Capacity | Severely limited by lack of HV transmission |
It can be mapped, the current and proposed transmission projects aiming to reduce this isolation, such as:
- Colorado’s “Power Pathway” Project
- TransWest Express HVDC line
- SunZia Southwest Transmission Project
Transcript
Click to expand
0:00
I'm in Gunnison, Colorado -- a town that made it  through the influenza pandemic of 1918 without
0:05
a single death from the flu. An accomplishment  that's even more incredible when you realize that
0:09
this place should have been hit hard. In the early  20th century this place was a popular railroad
0:14
hub connected to Denver and other mountain towns  that saw multiple deaths and hundreds of cases of
0:19
influenza. It was also home to active silver and  coal mining industries and a new college which
0:24
meant there were plenty of opportunities for  people to spread the fl. But somehow Gunnison
0:28
saw zero deaths during the pandemic. It's one  of a handful of places that made it through the
0:33
1918 pandemic unscathed. The others were rural  towns, small boarding schools, or military bases
0:39
that were easy to isolate. But Gunnison caught my  attention because it's a full-fledged town right
0:44
in the thick of things. So i came to Colorado to  dig through the archives hang out at the museum
0:49
and figure out how this town dodged the flu. But to  understand how they pulled it off, we need a little
0:54
bit of context. The 1918 influenza pandemic was  the deadliest pandemic in history. Between 50 to
1:01
100 million people died worldwide with 675 000  deaths in the United States. And this strain of
1:08
influenza was extremely contagious. And every major  city in the US dealt with outbreaks of the disease
1:13
from 1918 to around 1922. Now usually the flu is  deadlier for older folks than for younger folks
1:20
but this one was far deadlier for the young. And in  1918, big groups of young people were sharing close
1:26
quarters in camps, trenches, and hospitals thanks to  WWI which gave the virus opportunities
1:31
to spread. And thanks to the war, soldiers were  constantly traveling between army bases and
1:36
between countries. But the deadliest time frame  in the pandemic for Americans was the second wave:
1:42
which lasted from September to November of  1918 spreading across america from east to
1:47
west. One of our most hopeful strategies was  a vaccine. Scientists at that point had made
1:52
vaccines against diseases like smallpox, anthrax,  and diphtheria, so a flu shot seemed within reach.
1:58
Unfortunately we still had such a sketchy  understanding of the biology of influenza
2:02
itself. So back in 1918, our best strategy against a  pandemic wasn't medicine -- it was maps. Public health
2:09
experts were able to combine the movement and  location of troops with case numbers of influenza
2:14
to predict where the pandemic would hit next. And  after wreaking havoc on the east coast in the late
2:19
summer / early autumn, they were able to show that  it was heading westward. And that's what brings us
2:24
to Colorado. On September 20th, 250 soldiers arrived  in Boulder, Colorado for a training session at
2:30
Colorado University. 13 of those soldiers were  sick with the flu and soon afterwards, the
2:36
disease spread across campus then across town.  Within a week, Boulder developed 91 more cases.
2:42
A few days later, another train load of soldiers  came to Colorado Springs carrying 25 men sick with
2:47
influenza. From those two towns the virus spread  across Colorado, which got the attention of state
2:53
health officials and the governor who issued a  formal warning to the state on October 7th. A week
2:58
later the governor banned all public and private  gatherings across the state. And Colorado residents
3:03
were mostly supportive. They'd seen the kind of  destruction that the disease brought to the east
3:07
coast, so they complied with orders. But out here  in Gunnison, residents and local authorities took
3:13
the threat of influenza even more seriously. Their first rule: no one comes to town without
3:19
quarantining first. With so few ways into town, they  knew that if the virus was coming to Gunnison it
3:25
would come through the railroad. So they stationed  law enforcement at the train stop and subjected
3:30
anyone who stepped off the train to a few days  of quarantine. They also physically barricaded
3:34
the main roads here and here just in case. And it  wasn't just a warning either. Two men from Nebraska
3:40
were arrested and put in jail when they tried to  drive around the barricade and through the county.
3:45
Another man tried to get off the train  at Gunnison get out of his quarantine,
3:49
was arrested, and publicly made an example out of. The newspaper wrote his story on the front page
3:54
saying: "Gunnison had no flu and they didn't intend  to have any". But cases were still rising in nearby
3:59
towns, so the county physician decided to make the  quarantine even more restrictive -- blocking off not
4:05
just the town but the entire county on october  31st.
4:07
"In order that our lives and those of our families may be better safeguarded i have caused a  strict quarantine to be placed on Gunnison County
4:14
against the world. Barricades and fences have been  erected on all main highways near the county lines
4:19
lanterns at night and signs by day warning autos  to go through the county at once or submit to
4:24
quarantine. FP Hanson County Physician. Okay so  on the surface level that answers my question.
4:30
Gunnison escaped the influenza pandemic without  a single death because they enacted a super
4:34
ambitious quarantine. But that raises another  question: quarantines need at least a little bit of
4:40
buy-in from the people that they're quarantining  in order to work. So how did they get the people
4:45
of Gunnison to support the lockdown? Well that's  where the newspaper comes in. Remember this is all
4:50
happening at the tail end of America's involvement  in WWI. So the federal government, as well
4:55
as multiple local newspapers, purposely downplayed  the severity of the pandemic in order to keep
5:00
Americans confident in the war effort. In Chicago, Captain W.A. Moffatt said "while there are about
5:06
4 500 cases of the disease among the 45 000 blue  jackets at the station the situation in general is
5:12
much improved. The death rate has been only about  one and a half percent which is below the death
5:18
rate in the east". And maybe so, but that's still  around 50 dead soldiers. In Washington DC's Evening
5:24
Star, Lieutenant Colonel Philip Doane said "the  disease is nothing more or less than old-fashioned
5:29
grip". This guy also tended to blame foreign enemies  like in the Washington Times he said "The Germans
5:34
have started epidemics in Europe and there is  no reason why they should be particularly gentle
5:38
to America". Others told folks to look forward to  changing weather. Dr WC Woodward told the Arizona
5:44
Republican that "The forecast of continued fair and  cooler weather for sunday led them to predict that
5:49
there would be a marked falling off in the number  of cases reported". But Americans were living a
5:54
different reality. Their hospitals were overloaded, and their loved ones were dying in front of them.
5:58
Meanwhile the newspapers were saying that there's  nothing to worry about and that everything is fine.
6:03
This caused more and more Americans to distrust  the media. On the other hand, as soon as influenza
6:08
was reported in Colorado, the Gunnison News  Champion printed honest and transparent front-page
6:13
stories about influenza every week. They also  reported on people from Gunnison who had died of
6:18
the flu elsewhere. They took a global problem and  personally connected it back to their community,
6:24
which for the deadliest pandemic in history is  probably the appropriate amount of gravity to
6:28
give the situation. Now I went through dozens and  dozens of boxes of letters to see if i could find
6:33
out how regular people felt about the lockdown  but these were mostly letters to and from soldiers
6:38
stationed in France and none of them mentioned  the quarantine. So if there was any kind of public
6:42
outrage against the lockdown, I couldn't find any  record of it. Regardless, that was the routine for
6:48
four months: wake up, do your work, stay informed,  and try not to die -- and it worked. For reference, the
6:54
nearby town of Salida was rumored to have hundreds  of cases in October alone. In Silverton, there were
6:59
125 deaths in a single week, and with a population  of 130 the town of Sargents saw six deaths in
7:07
one day. Now there was one sick woman who came into  the Gunnison train station, but she died elsewhere,
7:13
which meant that the town of Gunnison made it  through the first and second wave of the pandemic
7:17
without a single case of influenza. In January  of 1919, local officials met with the state board
7:23
of health physician and decided to reopen schools  across the county. Attendance wouldn't be mandatory
7:28
and there would be a physician there checking  the kids for symptoms every day. But this was the
7:32
center of a huge controversy, or "much difference  of opinion among the opinionated". So Twitter today
7:38
basically. And on February 5th ,1919, Gunnison County  lifted their lockdown from the world. The third
7:44
wave came in mid-march but this time Gunnison  didn't implement any additional lockdown measures.
7:50
Luckily, the third wave was much more mild than the  previous two, so in the entire county there were only
7:55
five deaths. Regardless, this little town made  it through the deadliest wave of the deadliest
8:00
pandemic in history without losing a single life  to influenza. So what's the point? Are there any
8:07
practical takeaways from the Gunnison story for  modern day public health? According to historians
8:11
at the University of Michigan: maybe. And only in  specific circumstances. Quarantine can be effective
8:17
if it's enacted early if it lasts for the entire  time that that population is at risk and if that
8:22
population supports it. And that's exactly what we  saw in Gunnison in 1918. Otherwise, most of their
8:28
strategies for preventing the spread of disease  didn't really do anything back then. And while most
8:32
of our non-pharmaceutical interventions are the  same as back then (like masks and social distancing).
8:37
The big difference is that pharmaceutical  interventions are way better than they used to be.
8:41
That's why there's such an emphasis on vaccination  for modern pandemics and less reliance on masks
8:46
and quarantines. Now, we're heading into  my personal opinion territory, but to me
8:51
the difference between Gunnison and other cities  wasn't the quarantine -- it was their communication.
8:56
Right? There was no doctor or medical invention  that saved the day. The real star of this story is
9:02
the newspaper. The Gunnison News Champion did the  best with the information they had. They relied on
9:07
experts and they didn't try to cover anything up. And in the end they earned the trust of the people
9:12
they were trying to communicate with. The lesson to  learn from Gunnison is that people respect honest
9:16
and clear communication regardless of whether the  message is good or bad. But that's just my takeaway.
9:21
What is the lesson to learn from Gunnison? Let me  know in the comments. If you want to hear another
9:26
story about public health and how we manage  pandemics go ahead and click on this video
9:30
right here. Otherwise thank you to all my patrons  on Patreon. Have fun, be good thanks for watching.
Influence of the Cold
The word influenza comes from the Italian phrase “influenza di freddo”, which literally means “influence of the cold.”
🔍 Etymology Breakdown:
- Latin Root:
The word originates from the Latin influentia, meaning “influence” or “a flowing in.” - This Latin term was used in medieval astrology to describe the supposed “influence” of stars and planets on human health and affairs.
- Italian Adoption:
In the 15th century, Italian doctors began using influenza to describe diseases thought to be caused by invisible celestial forces—especially epidemics. - Specific to Colds and Fevers:
By the 1700s, “influenza” in Italian referred specifically to “influenza di freddo”, or the “influence of the cold”, believed to bring about feverish respiratory illness in the winter. - English Usage:
The term entered the English language during the 1743 European flu epidemic, after which the illness became commonly known as “influenza.”
Summary
| Term Origin | Meaning |
|---|---|
| Influentia (Latin) | A flowing in; celestial or magical influence |
| Influenza (Italian) | Illness attributed to weather or stars |
| “Influenza di freddo” | “Influence of the cold” (cold-induced sickness) |
| Modern “Influenza” | Viral respiratory infection |
So, the word “influenza” originally meant an invisible influence, especially one from the stars or the cold, believed to cause seasonal outbreaks of disease—centuries before viruses were understood…or power grid and other electrifications as most likely causal to influenza outbreaks and other diseases.